TOOLS PROVIDED
Analytics Solutions
Global Peer database
One of the world’s largest database of performance insights, Global Peer uses proprietary transaction data from asset managers encompassing more than 20% of all institutional equity trades globally. Each stage of the investment process is compared to that of industry peers trading under the same conditions to systematically assess the quality of executions.
Agency Cost Estimator (ACE)
Optimize your execution outcomes. Our proprietary ACE model estimates costs, compares essential data and evaluates market conditions for 50+ markets using historical volume, volatility and spread data throughout all touchpoints of the trade life cycle. ACE is recalibrated quarterly with trade data from our Global Peer database.
Portfolio Optimizer
Put your ideas into practice efficiently using our optimization tool to test portfolio constructs. Factor in model risk, transaction costs, taxes and constraints until you discover your optimal mix. Use the system’s built-in back-testing environment to create cost-effective trade lists immediately and for the long term.
Transaction Cost Analytics (TCA)
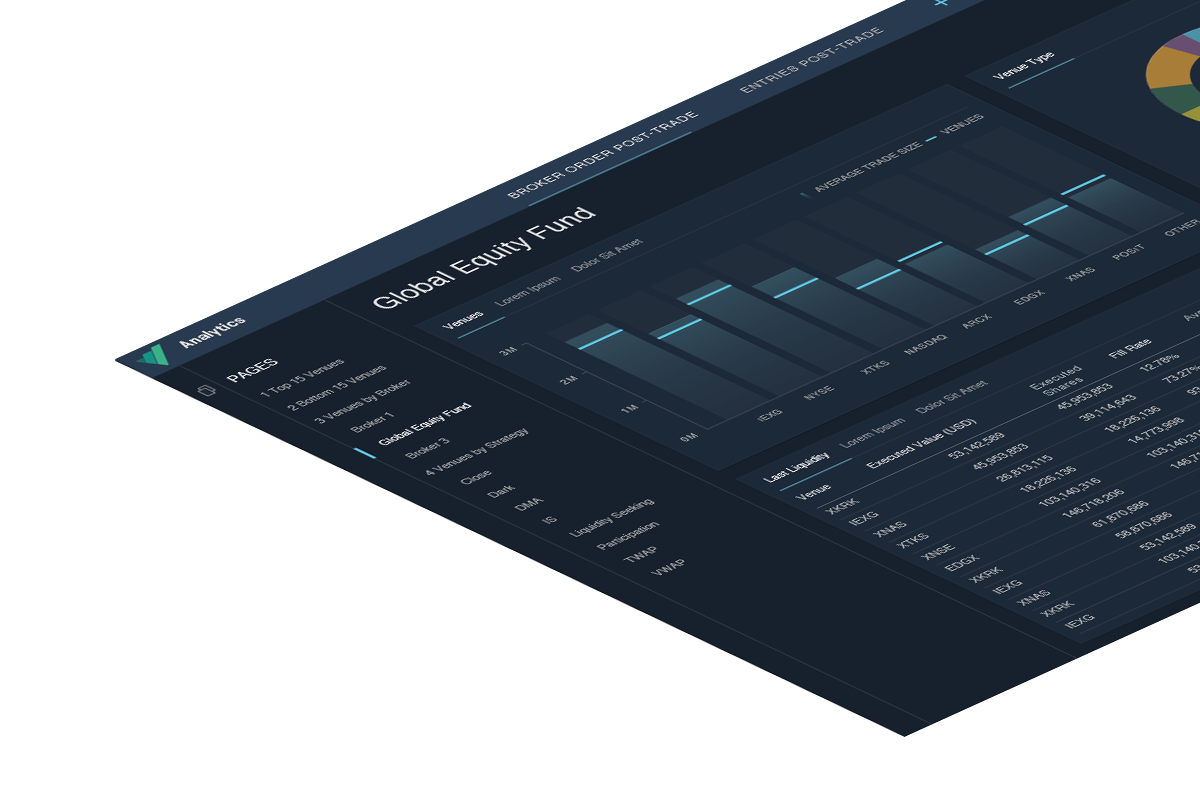
75% of the largest institutional asset managers rely on our multi-asset TCA to help measure and improve their execution performance before, during and after trades. They count on actionable intelligence sourced from our Global Peer database, Agency Cost Estimator model, 100+ standard benchmarks and 200+ custom benchmarks designed to meet specific measurement requirements across equity, FX, fixed income and futures instruments. All geared to helping improve performance and reduce the costs of investment implementation.


SPOTLIGHT
Open Technology Platform
Bolster your data. Enrich your intelligence.
Powered by Virtu, the new Open Technology platform leverages our global and multi-asset class foundational products and client-focused offerings into a data-as-a-service solution. The platform offers a growing library of application programing interfaces (APIs) and other tools to supply you with your Virtu data.


